Exploring Behavioral App Data Through Gaming, Ratings, and Demographics
Carolina Data Challenge 2021
By: Grant Everist, Jacob Turner, Rodrigo Meza and Zach Chaloupecky
Introduction
Methods, resources
The Worldwide Mobile App User Behavior Dataset was chosen to be analyzed. R, Python, Excel and Tableau were
used for statistical analysis, AmCharts 4 was used to create maps. On the JavaScript side of things,
WebPack, Bulma, Bootstrap, and Babel were used. Questions were created after a careful look at the data.
We have created 3 different questions to analyze:
How do age and education demographics differ among respondents by country?
How do age and country determine the amount of game apps downloaded?
Which people review apps and how does the country of residence effect on their reviews?
Demographics
Hovering over a country will show more information about
that country. If the country has no data available, the hover will only display the country name.
Education level was also measured on the following scale:
(1) Primary
(2) Secondary / High School
(3) Diploma
(4) Vocational
(5) Undergrad
(6) Masters
(7) Doctoral
(8) Other
Looking at the distribution of education by country of those that took the survey, we found the results mostly followed the averages shown by the map above. Outliers include Korea's responses, which were oddly low, however based on question 2, we can attribute this to age rather than average education level. Thus
the average education level was much lower. China's data was also interesting due to the high concentration of those with a Undergrad degree. While we can't make any firm
conclusions of why this is, it may also be related to age and the surveying methods.
These data are important as it could help market apps to countries based on education level. For example, a learning app should be promoted in countries like China,
where a high amount of those surveyed were undergrad.
Oddly enough, very few Americans responded to the survey despite it taking place in the US. This is opposite of China and Canada, who had the 2nd and 1st amount of responses.
These data are important in the overall analysis; some responses may be skewed due to the influence of these populations over those that had few responses.
Gaming
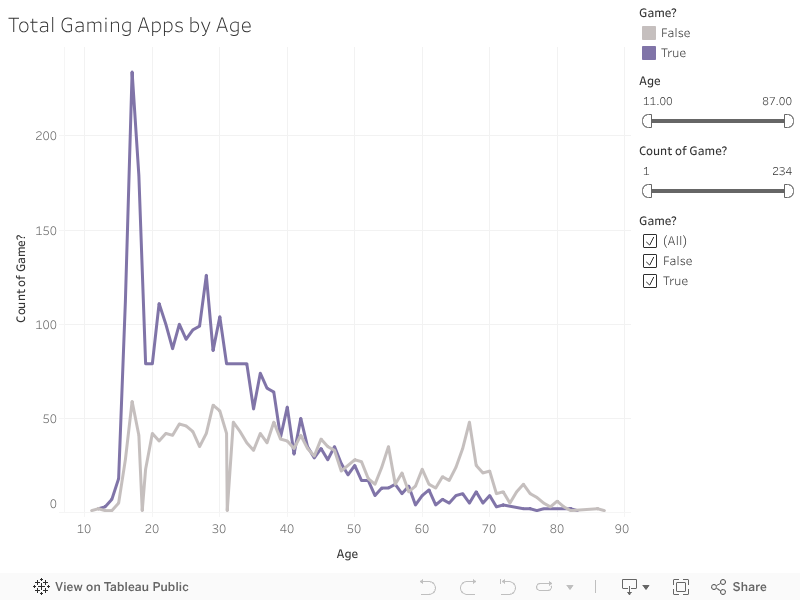
The next area we wanted to look at was how users viewed games as apps. The graph below shows the distribution of those that play games against those that don't. As expected, most of the older respondents did not play games. however, near the 40-45 age range, there were equal amounts of those
that played games and those that didn't. This was relatively surprising, as we predicted even at that age range, most wouldn't play games. Of course, the younger ages had the highest ratio of those that play games against those that don't. While these data aren't surprising, it reaffirms the tatic
of advertising and focusing on youger populations.
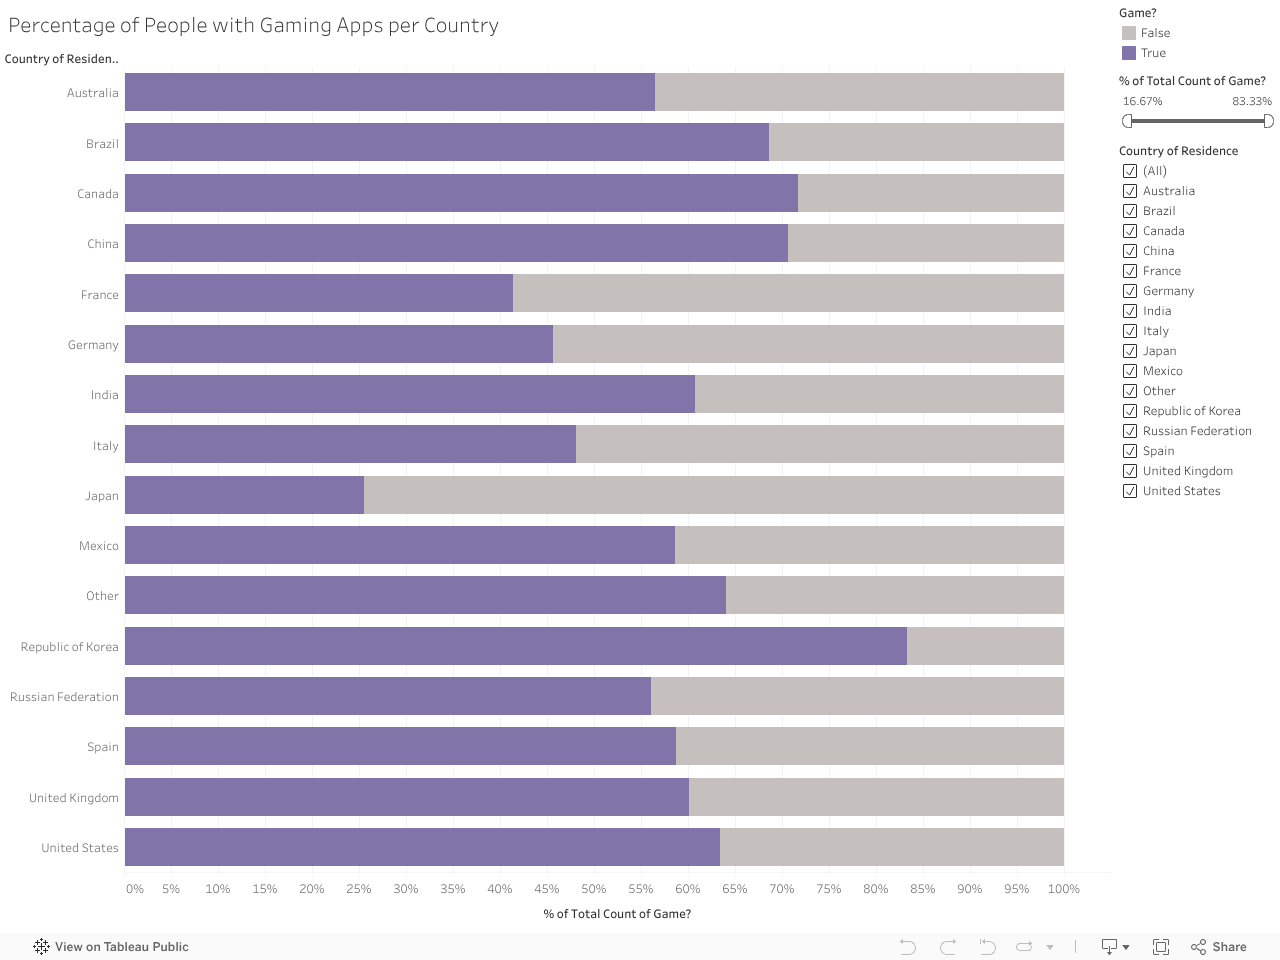
Given our previous question, we also wanted to tackle how game playing differed by country. Most of the data here was also not surpising (Korea and China having large mobile gaming populations), however there still were interesting results. In particular, we found that Japan's mobile gaming market was surpisingly low.
Japan is a very work centric country and as a result we thought that mobile gaming would be a much bigger market. While the cause for this low amount isn't known, we believe the impact of other mobile gaming options like Nintendo Switch may impact this number. Another surprising point was the large proportion of gaming in Canada.
If more time alloted we would plot Canada's age vs gaming playing to see if these result correlate more with age. Just like age this information is important for marketing and developing games. Catering to Japanese markets might not give as much as a profit as catering to Korean markets.
Ratings
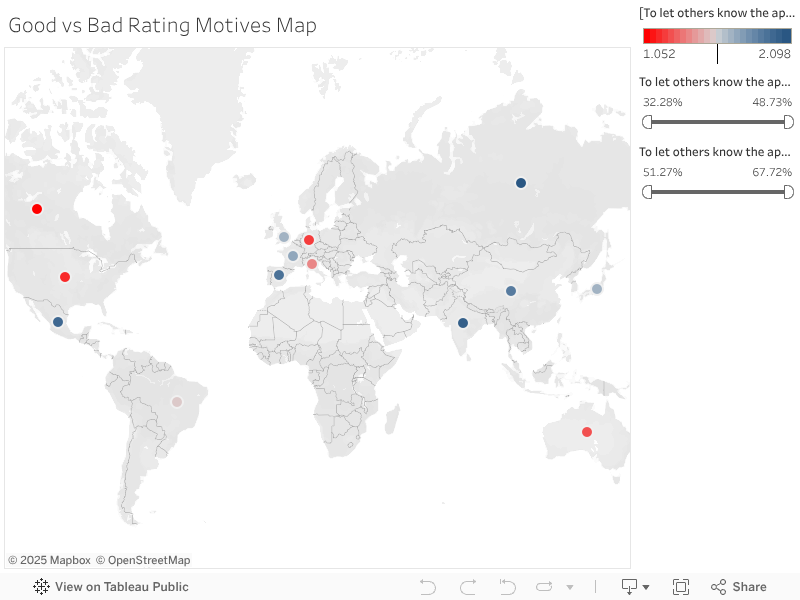
We wanted to investigate how people reviewd apps. The first map below shows the percentage of how people review apps based on country. For example Russians typically let others know if an app is good (67.72%), but rarely if it's bad (32.28%). Most countries had a high percentage of people letting others know an app was good, while few let others know if it was bad. However Canada, US, and Germany were more equal in good and bad ratings.
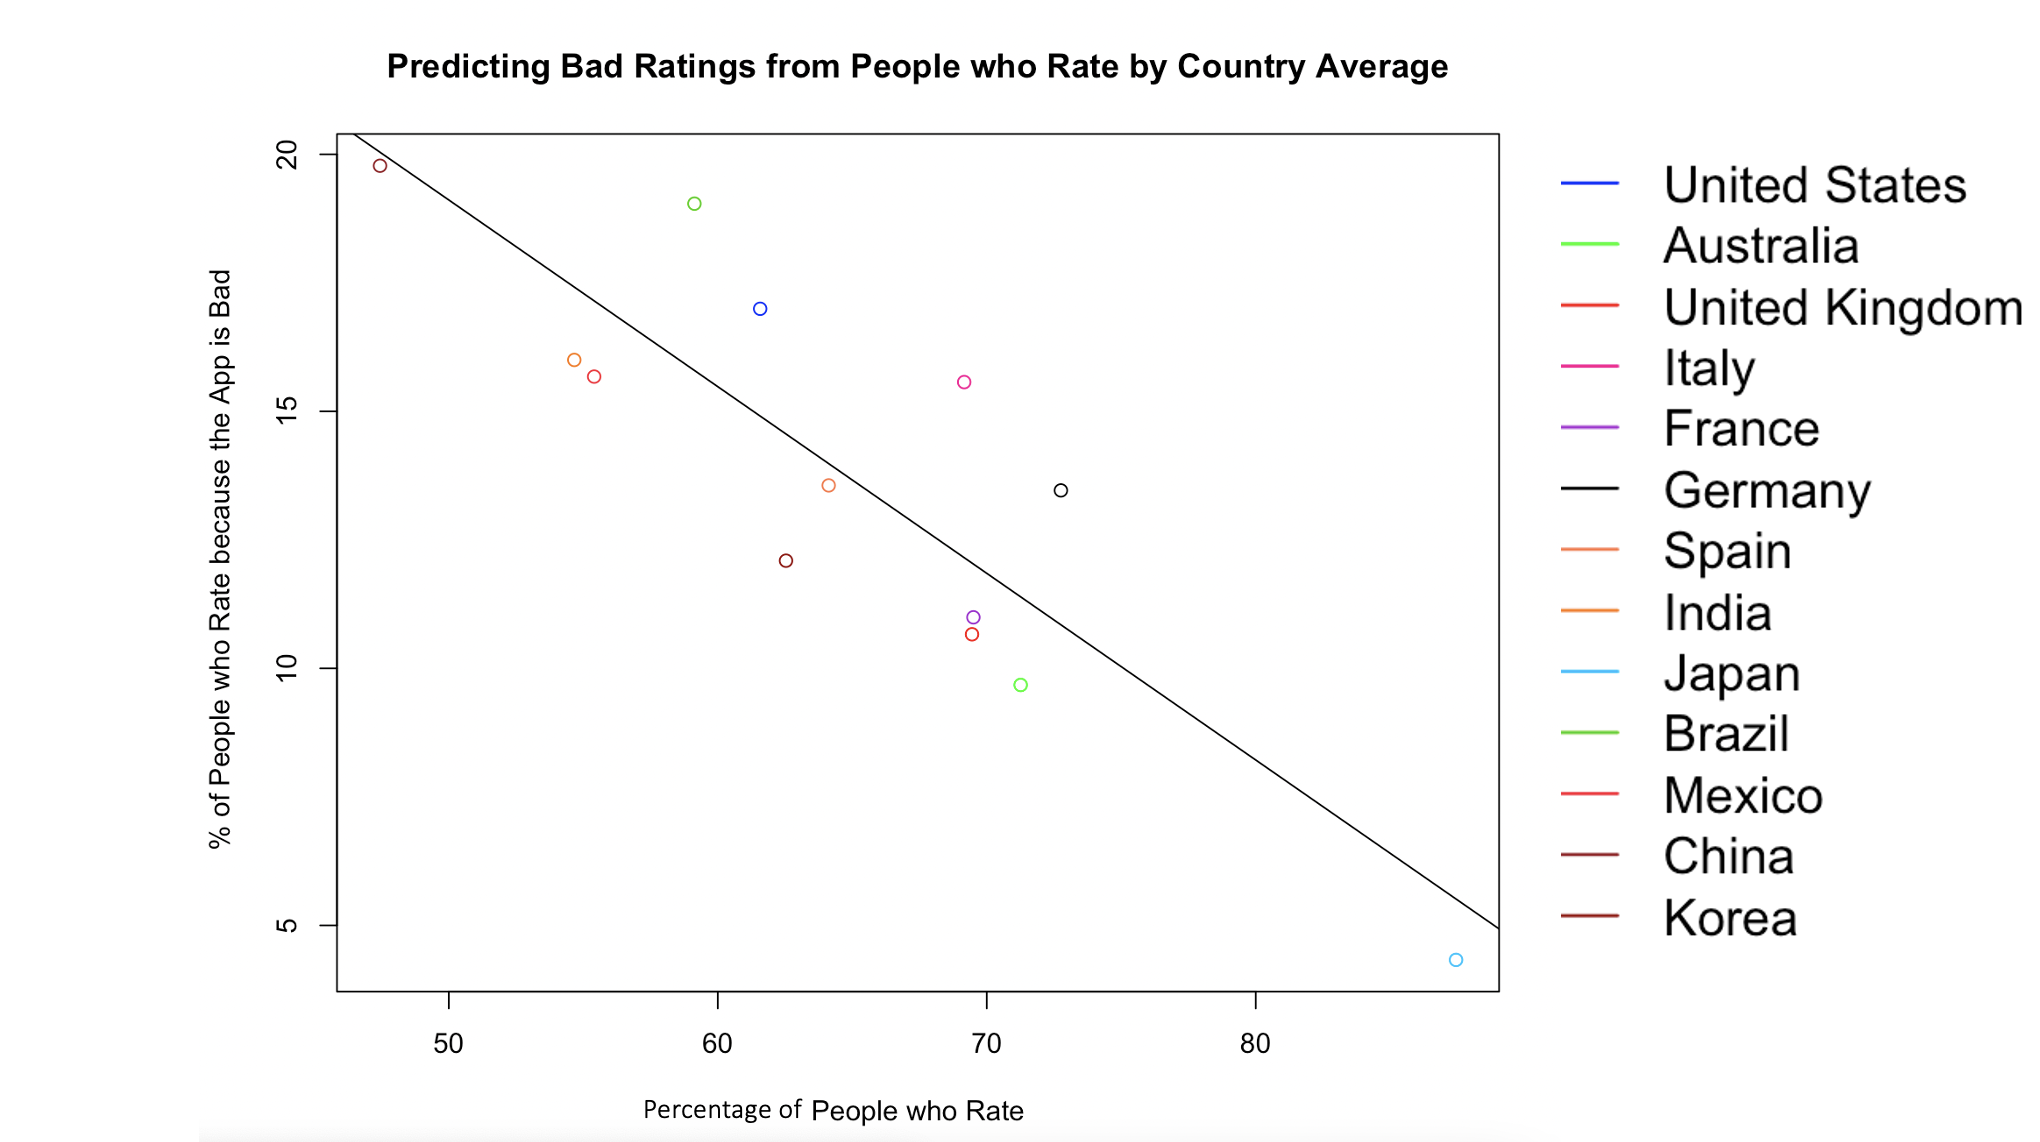
The next graph offers a model for predicting bad ratings based on people who review apps. We measured average reponses by country and the result was expected. In general those that reviewed apps
often were more likely to review an app positively, while those that didn't review apps were more often to give negative reviews. The p value obatined from this model was .0001 indicating a very large statistical siginifance.
The R-squared value was also somewhat high at .7367, again indicating a good fit.
Conclusion
From these data we analysed, we reaffirmed gaming marketing and presented areas for marketing in relation to educational apps. We also saw the general population demographics based on those that repsonded to the survey.
For further research, we recommend either focusing on one market with a larger sample size (i.e. gaming) or to ask more quantitative mesaures as a way to make predictive models easier.